About this Project
The client’s new technology creates “fabrics” out of network devices. Network administrators would then be able to segment the existing network into logical pieces for ease of management.
Our team was tasked to design the frontend application, responsible for two major functionalities, Provisioning and Monitoring & Troubleshooting (M&T). I worked as the project lead and UX designer, and my teammate handled the visual design.
Challenges
Right away, we noticed that the existing Provisioning process was long and tedious. The most significant part of the process, fabric provisioning, was performed last. Additionally, the dashboard, designed for M&T, was rich with data but monotonous.
How do we present a modern and simple identity for the introduction of this new technology, despite the technical intricacies of the new product?
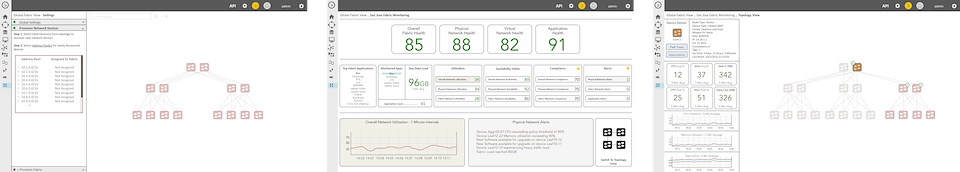
Figure 1 – Client mockups for Provisioning (left), Monitoring & Troubleshooting (middle and right).
While the targeted users (network administrators of large enterprises) are excited about the potential flexibility and manageability afforded by the new product, they expressed sizable hesitation in deploying a brand-new product onto their production network.
I like your features…but don’t touch my core devices! I can’t afford for any of it to go down.
- Network Admin from IT Conference
How do we help network administrators feel comfortable with brand new technology?
Insights
We made a few insights based on our observations and discussions with the client’s team. These insights helped steer the direction of our final design.
To simplify the user experience and help users feel like the technology is truly an improvement, we should put the focus on fabric provisioning, not the plumbing that is network provisioning.
The product must be as transparent as possible in order to earn the network administrator’s trust. The user should feel empowered, not outmaneuvered by the technology.
To earn the network administrator’s trust, the product needs to allow for gradual adoption in the organization’s network.
Result
To allow for front-end development to happen in parallel, we split the project into two phases: Provisioning and Monitoring & Troubleshooting (M&T).
For Provisioning, we focused on simplifying the process while keeping the user comfortable and informed. We wanted this brand new product to make a good first impression. We made sure to be as specific as possible when it comes to the scope of the provisioning and cut it up into digestible chunks.
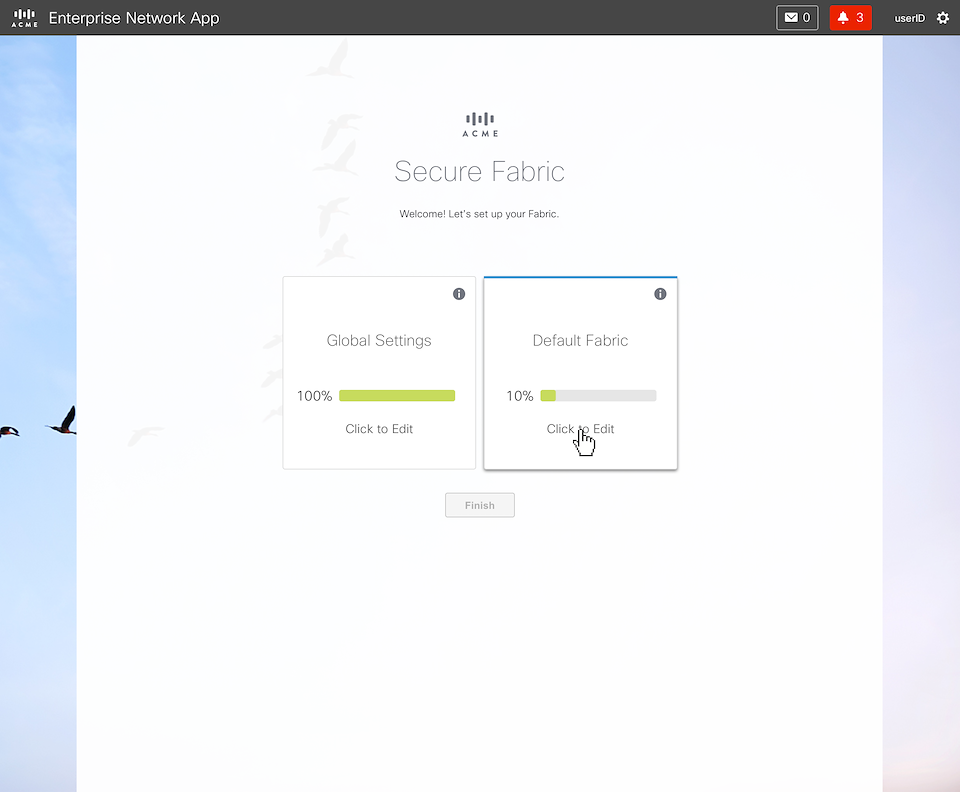
Figure 2 – Provisioning can take a while, so we divvy up the task into digestible chunks and allow the user to leave and come back at any time.
Rather than being last, fabric provisioning is now center stage of the entire Provisioning process. To provision the fabric, the user just needs to select the devices for the fabric. Recommendations for device roles are automatically made in case the user doesn’t know or want to bother.
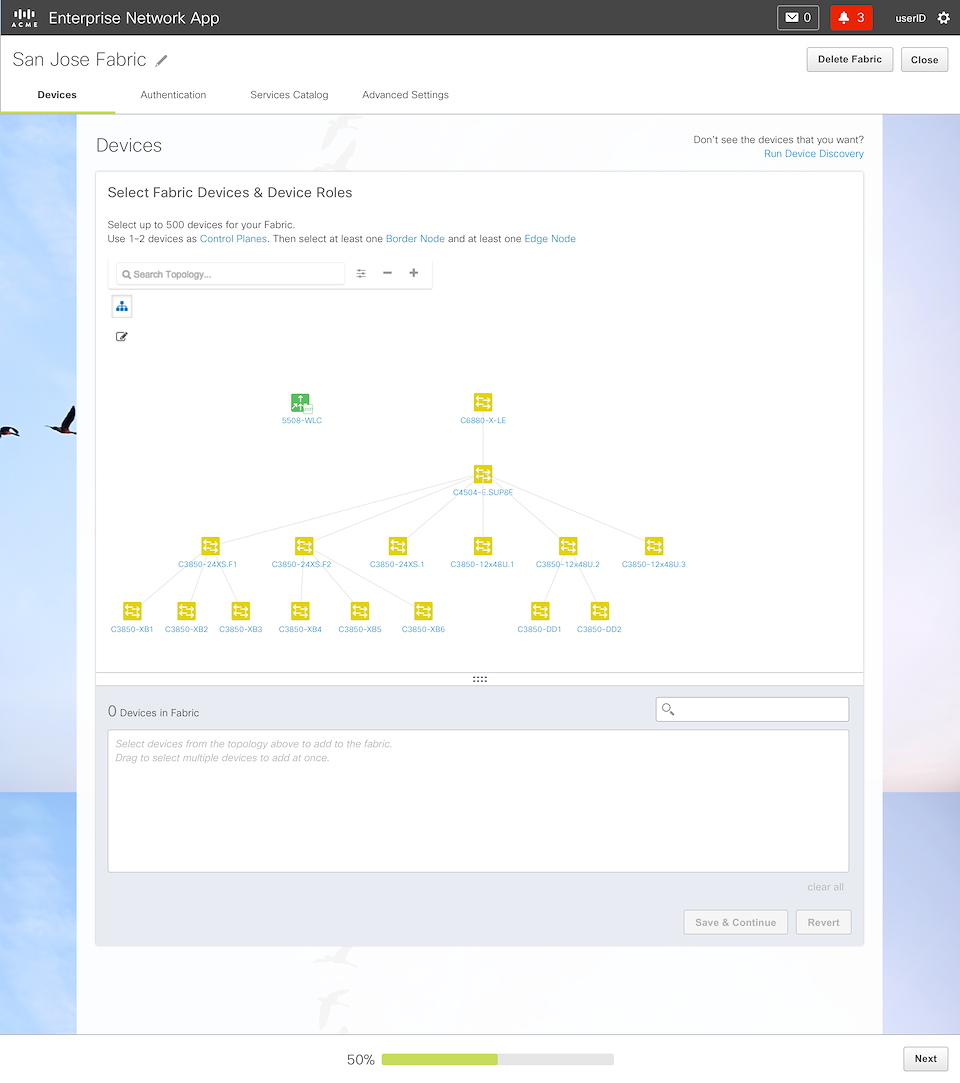
Figure 3 – The primary task to complete during provisioning is to select devices for the fabric. The user only needs to worry about network provisioning if the devices they want to select, e.g. a newly purchased switch, has not been discovered yet.
Figure 4 – Animated sequence showing the workflow for selecting devices and assigning roles. We try to automate as much as possible.
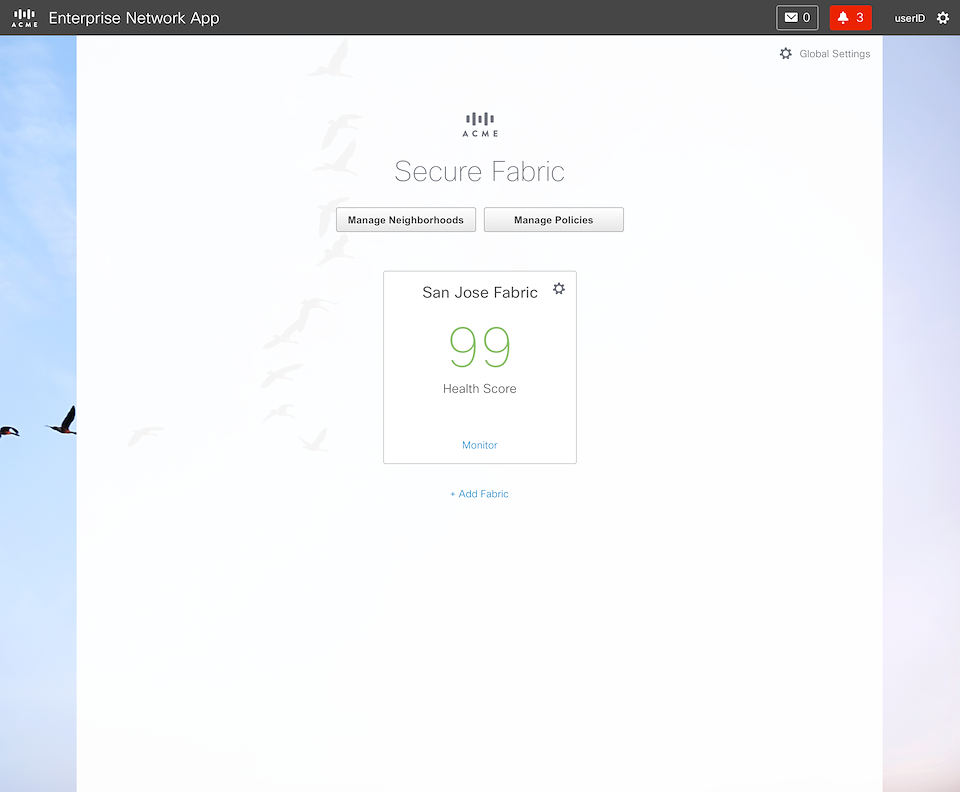
Figure 5 – Once the Provisioning steps are complete – congratulations! The first fabric has been created and is ready for use.
Note that in the above process, network provisioning is not mentioned. The user only needs to bother with it if the devices they want to use for the fabric have not been discovered yet.
Once the fabric has been created and provisioned, it is “live”. We designed a dashboard to monitor the health of the fabrics. This is what M&T is all about.
Also front and center on the dashboard is the search bar. This search bar is designed to make troubleshooting as painless as possible. It allows the user to quickly find a device and perform common troubleshooting actions on it.
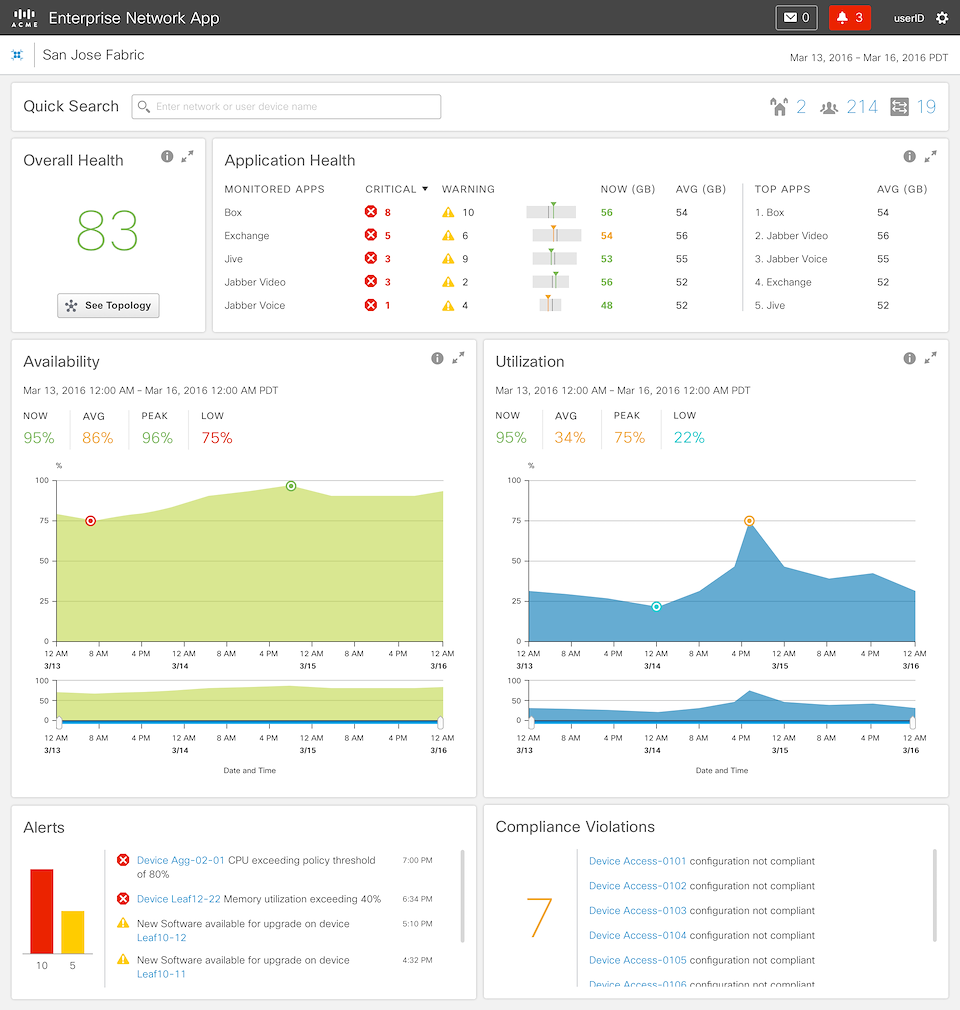
Figure 7 – Dashboard showing the health and various additional performance metrics for the fabric.
Figure 7 – Animated sequence for the Search Bar, where users can quickly search for a device and execute common troubleshooting commands.
The topology button near the health score takes the user to the fabric topology, made up of devices that were selected during the provisioning phase. The topology is where the user can dig down into individual devices.
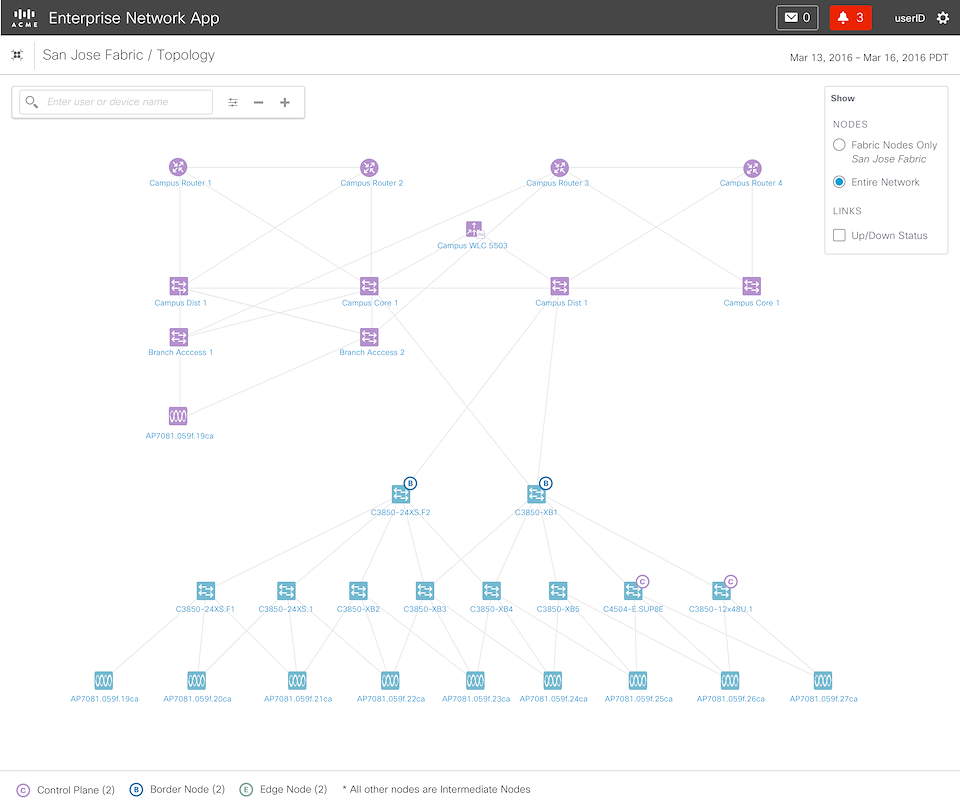
Figure 8 – The fabric topology is made up of devices that were selected during the provisioning phase.
Figure 9 – Animated sequence showing how the link states (up/down) become visible upon hover. When a device is selected, the bottom pane pops up with device details for the selected device.
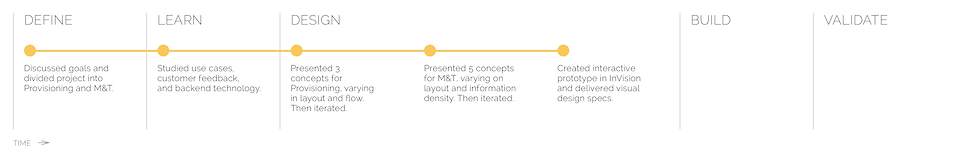
Process
The following illustrates the process the design team went through for this project:
Beyond this Project
After the design was delivered to the client, the client’s development team started to build it. Customer feedback on the prototype, especially on the Search Bar feature, was very positive.
We had a chance to further iterate on the design when the customer came back to us with a continuation project: Software Defined Networking – Wireless Edition.