About this Project
This project is a continuation of the “Software-Defined Networking” project, but focuses on the wireless rather than the wired part of the network.
We took this opportunity to enhance and iterate on the previous design. I worked as the project lead and UX designer. My teammates included a visual designer and a junior UX designer.
Challenges
At first this project seemed like a logical extrapolation of the previous project – just add the wireless bits, right? Upon closer inspection, however, the challenges became clear.
First, wireless networks have distinctively different and more complicated characteristics than wired networks. For one, think of all of the laptops, phones, tablets, and other proprietary devices come and go in a wireless network.
How can we optimally accommodate both wired and wireless networks in the same application?
Second, complexity is a slippery slope. In the previous project, we took great care to keep only the essentials of the wired network so that the user experience is simple and modern.
How do we stay true to that spirit of modernity?
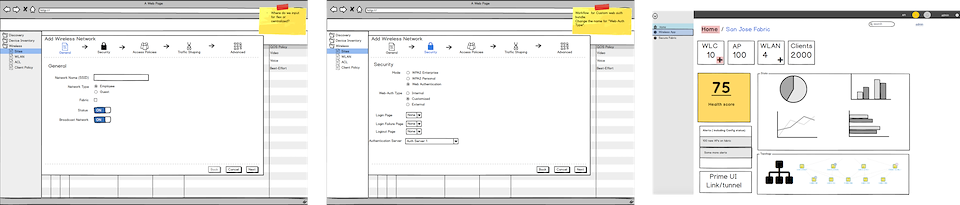
Figure 1 – Wireframe mockups from the client team, showing the requirements for wireless network Provisioning and ideas for wireless network M&T.
Insights
We worked with the client’s engineering and technical marketing team to arrive at a couple key insights:
As seen in the client’s Provisioning wireframes, the focus was placed on the wireless controller (a device) because it is a backend prerequisite. However, we felt that to improve the user experience, more of the focus should be shifted to the wireless network itself.
The wireless controller is just a means to an end. At the end of the day, providing wireless access to the users in the network is the goal.
In a large enterprise organization, the administrators for the wired network and the wireless network are likely two different individuals with two different skill sets. Each is trained to look out for a certain set of signals and cues. For example, the transience of wireless network traffic is something a wired network administrator rarely has to worry about.
It’s best to keep the Provisioning of wired and wireless networks together, but when it comes to Monitoring & Troubleshooting, the wireless network deserves to a separate space.
Result
We divided the project again into two parts: Provisioning and Monitoring & Troubleshooting (M&T).
For Provisioning, we extended the design pattern from wired Provisioning. Wireless controllers will show up on the topology and can be added to the fabric, just like any other network device.
Figure 2 – Animated sequence showing the the workflow for adding wireless controllers to the fabric
After the wireless controllers are in place, all that’s left to do is for the user to choose which wireless networks to make available to users in the fabric.
Figure 3 – Animated sequence showing the enabling and disabling of wireless networks.
For Monitoring & Troubleshooting (M&T), we designed separate dashboards because wireless metrics are vastly different from wired metrics. Simply adding the wireless metrics to the original dashboard design would have yielded something overwhelming.
Through conversations with the client team and careful studies of the use cases, we elected to put only the most commonly used metrics on the dashboard. The rest are hidden by default but configurable by the user.
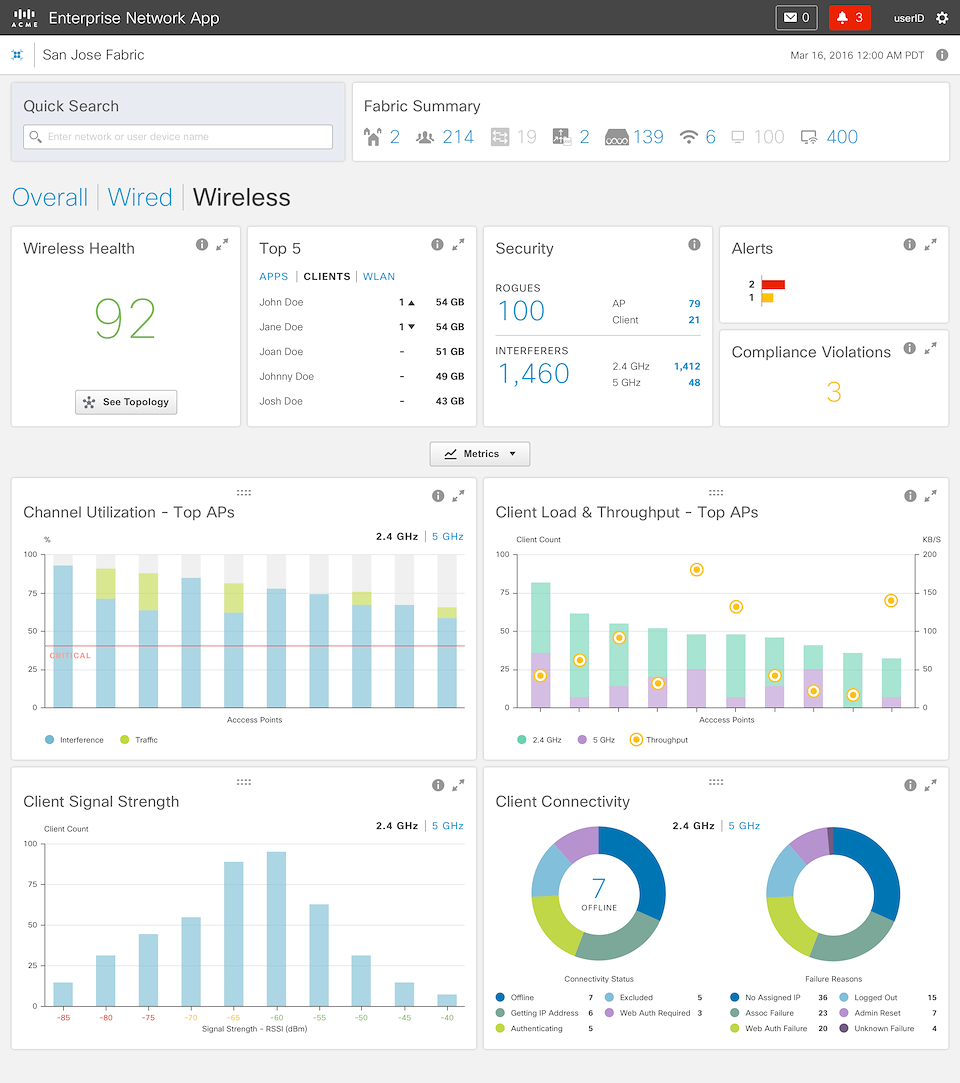
Figure 4 – We designed three different dashboards for three different purposes. The one shown here is designed for the Wireless administrator.
Figure 5 – Animated sequence showing the three different dashboards and the showing/hiding of dashlets.
The topology is where the user can get detailed information about each device, and there are lots of information, differing based on device type. A wired switch shows entirely different metrics than a wireless access point.
We designed a series of miniature dashboards, or dashlets, to be used by each device type Some dashlets, like “CPU Utilization” is common across all devices, but others, like “Top Clients”, are quite specific to the device type.
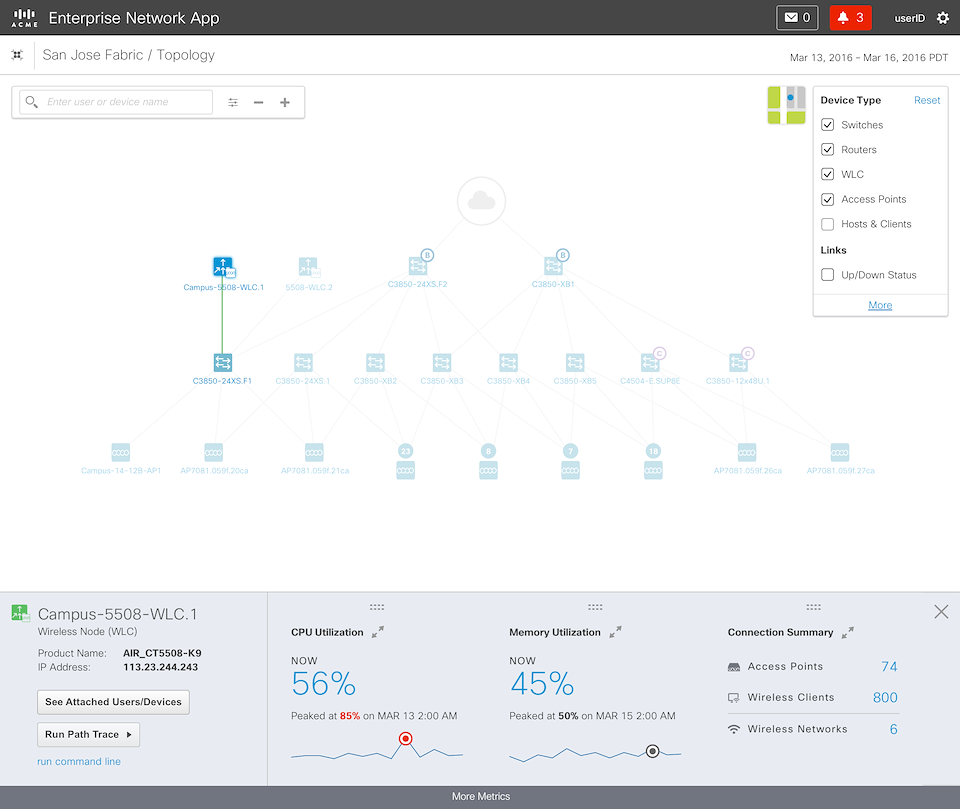
Figure 6 – Topology. With the addition of the wireless network, the topology went from showing just one type of device, namely, switches, to four device types.
Figure 7 – Animated sequence illustrating the showing/hiding of additional dashlets. Dashlet positions are configurable via drag-and-drop.
One major challenge was the drilldowns. Every dashlet on the dashboards and topology require a drill-down. Designing unique drilldowns for each dashlet would have resulted in a combinatorial explosion, exhausting for the team and incomprehensible for the users. After studying the metrics carefully, we created five design patterns to be used across the application.
Figure 8 – Five design patterns (A through E) to handle the various drill down scenarios.
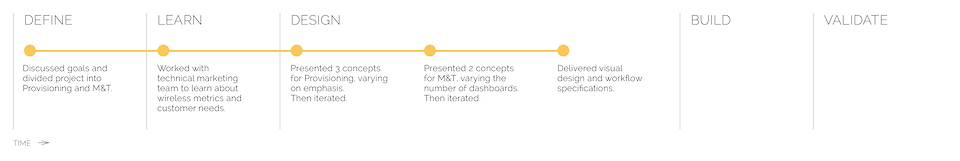
Process
The following illustrates the process the design team went through for this project:
Beyond this Project
This project was effectively the second iteration of the Software-Defined-Networking project with the addition of wireless networks. After we delivered the final design, the plan was for the client team's development team to fold it into the next release.