About this Project
The client’s team wished to develop an application that showcases intent-based (rather than device-based) policies, so that the policies can be managed alone by policy administrators (rather than depend on network administrators).
We were tasked to create a proof-of-concept. I worked as the project lead and UX designer, while my teammate supported me in visual design.
Challenges
"Global” means that the proof-of-concept must work across both the enterprise and datacenter domains. More and more network administrators finding themselves in the midst of dealing with both domains.
How do we create a scalable and intent-based policy application suitable for both enterprises and data centers?
The underlying technology supporting intent-based policies is an open-source project with established use cases and APIs. It is very powerful, but the seemingly endless configurable options also make it extremely complex.
How do we successfully translate between a complex model and the user’s needs?
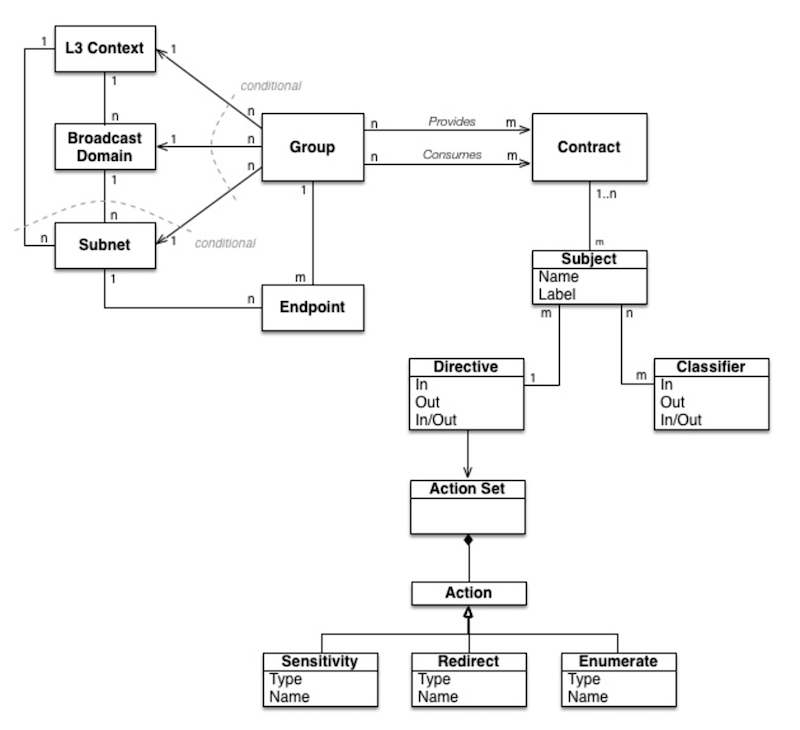
Figure 1 – Information model of the Group Based Policy backend from the GBP OpenDaylight wiki page.
Insights
The more we learned about the user’s environment, the more we realized that scalability will be key. With hundreds of applications and thousands of users, no one person can manage or care about all of the policies at once.
Policies should be presented based on the entities the user cares about, e.g. user groups, applications, and other resources.
Although it is nice to declare that the application is a “one stop shop” for both enterprise and data center domains, the policy administrators only configure policies for one “entity” at a time. They’re either configuring access policies for say, contractors in a department, or the network privileges for a farm of new applications servers.
Configuration of policies remains separate for the two domains. Monitoring and visualizing policy health for both domains simultaneously more valuable for users.
Result
There are two major components to the design: policy visualization and policy configuration.
First, policy visualization is all about the deployment and enforcement of the policies. The dashboard reports the health of the policies with in terms of Groups, Services, Devices & VMs. It aims to communicate two important statuses:
- What has been happening with policies?
- How far is the actual state of policies from the intended state (and what’s causing the deviation)?
/background(fff)/960x1409.jpeg?auto=webp)
Figure 2 – The top half of the dashboard exhibits a summary of the system. The bottom shows various metrics related to policy health. The first tab, Policy Changes, shows a change history of the policies to facilitate knowledge transfer and auditing.
/background(fff)/960x1409.jpeg?auto=webp)
Figure 3 – Policy Health for the Groups. “How faithfully are the policies I configured being enforced?” Similar policy health information is shown for Services and individual Devices & VMs.
Next comes policy configuration. The policy administrator configures policies between Groups and Services, and does not need to know anything about device capabilities or network speak like IP addresses. Services are resources (e.g. database servers) that are packaged with some rules. Different rules are specified for different intended Groups.
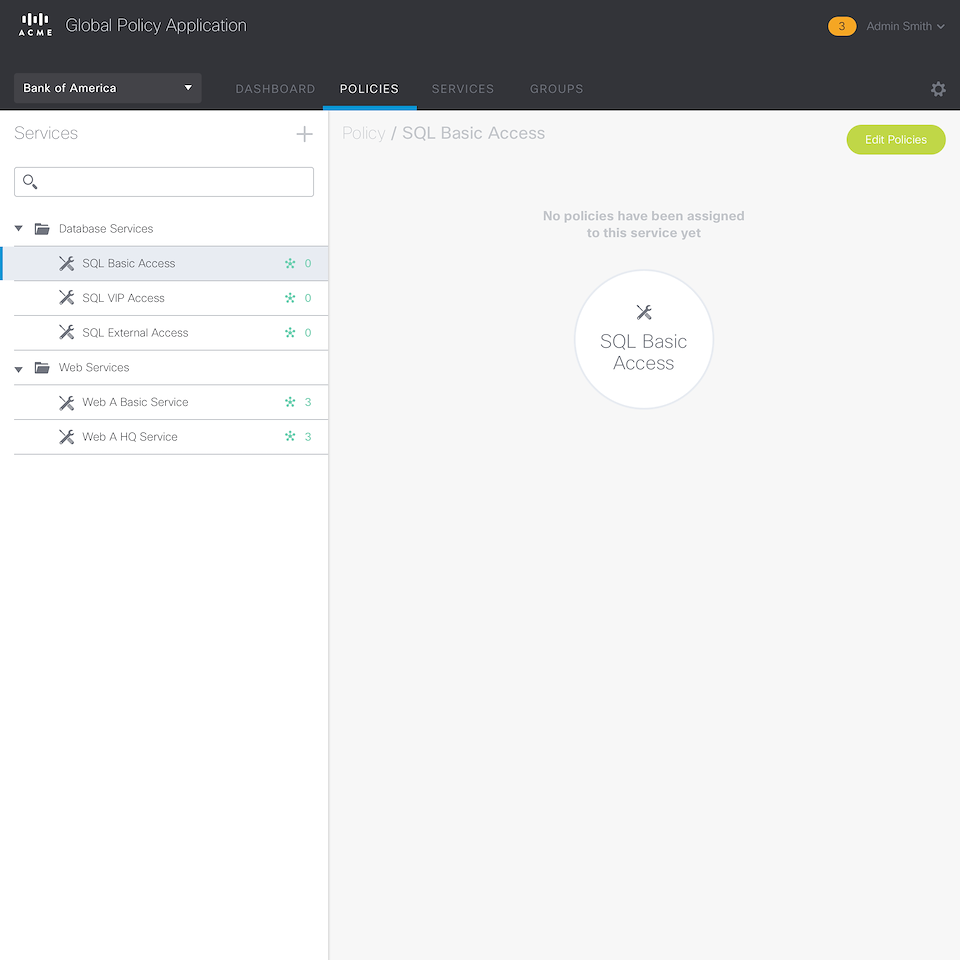
Figure 4 – Policy Configuration page. Shows the access policies of the selected Group or Service. “What services does this group have access to?” and “What has access to this Service?”
The user drag-and-drops to make connections between Groups and Services. Groups are generally the users in the network and Services are the resources the users need to do work.
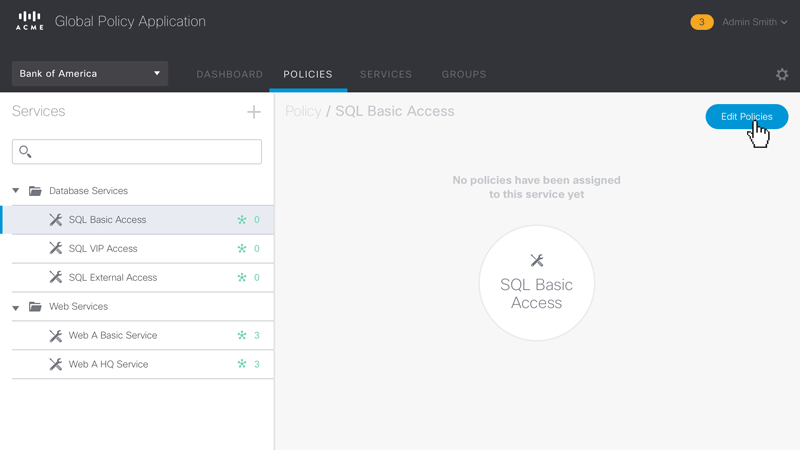
Figure 5 – Animated sequence showing the workflow for editing the access policies for the Group ‘SQL Basic Access’.
A Service is basically a resource paired with some usage rules. For example, the database servers could be paired with a lenient rules, designated for full-time employees. And the same database servers could be paired with strict rules, intended for temporary contractors.
Rules editing can get tedious. To make it as easy as possible for the user, we designed a drag and drop interface and reduced the options down to the most common ones.
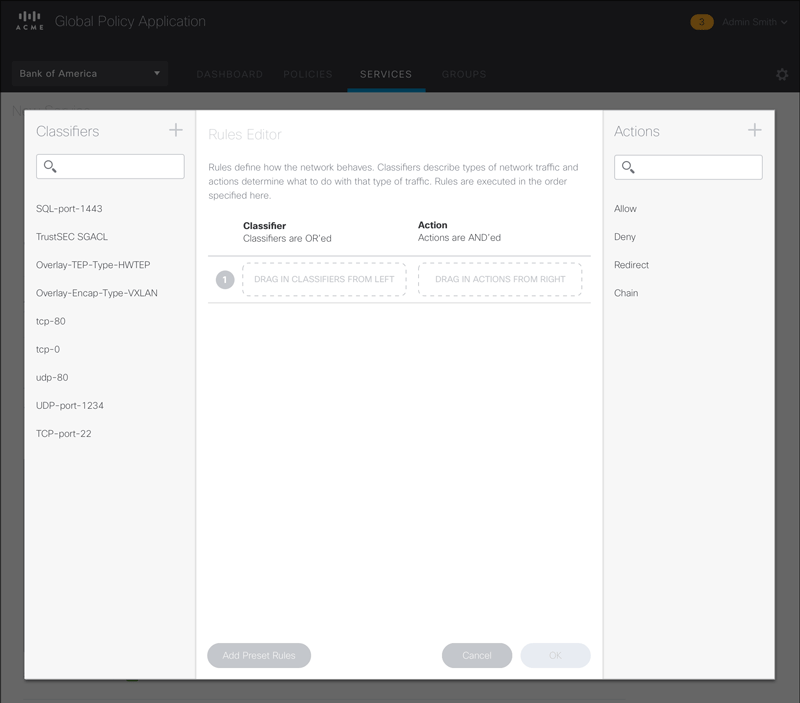
Figure 6 – Animated sequence showing the drag-and-drop workflow in the Rule Set Editor.
Process
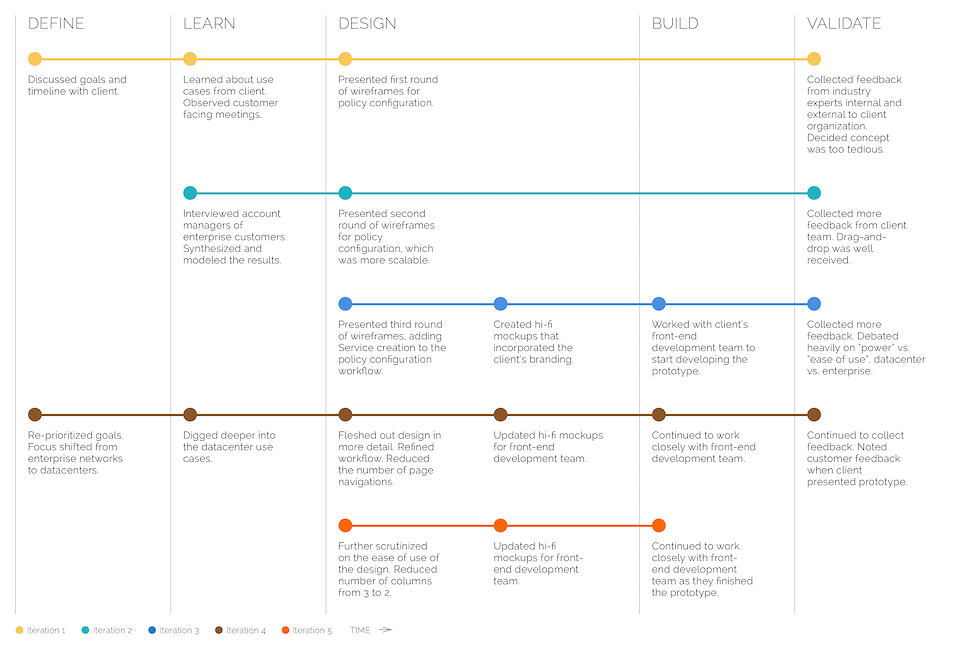
Because it was a proof-of-concept, we iterated very quickly for this project. Though the iterations can seem erratic at times, we still adhered to the design process. The following shows the process we went through for one of the major features – Policy Configuration:
Beyond this Project
This project was intended to be a proof-of-concept. We worked closely with a team of front-end and back-end engineers to develop a working web application on top of a shell backend. No actual policies were written to the network devices but users were able to get an accurate taste of the workflow.
The proof-of-concept was later adopted into an actual product in the project “Enterprise Policies”.