About this Project
“Solutions” are suites of products targeted for specific use cases, e.g. entertainment or security. Because the product line is new, product managers have to manually manipulate quarterly financial data in Excel spreadsheets, which is tedious and error-prone.
Our team was tasked to design and develop a Qlik app that can be used to report the data. I worked as the project lead and UX designer, while my teammates handled the visual design, data analysis, and development.
Challenges
We completed two iterations of this dashboard. The timeline for the first iteration was extremely tight. In addition to delivering the finished application on time, the second biggest challenge was to get the user to trust the application and find it attractive enough to use.
How can we get the user to like and want to use the tool?
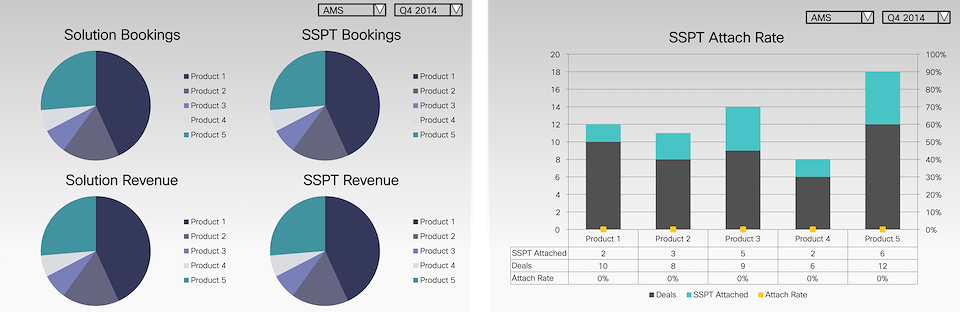
Figure 1 – Client mockups for comparing bookings (left) and attach rates (right).
Insights
Due to time constraints, we completed the first iteration with minimal user input. After it was deployed, however, it brought us important feedback from the field.
The product managers found graphs appealing, but being seasoned Excel users, they really felt at home with numbers and tables.
Each quarter, the identical data set is delivered to each product manager, but different users require different “facets” of the data. Some of that is due to job responsibility, while some of that is due to security.
No two product managers actually look at the same set of data. Filtering capabilities must be front and center.
Result
The final design starts with an executive summary of the most current quarter. Large metrics accompanied by small trend graphs. This is likely the fidelity executives (managers of product managers) will stop at, as they are more likely to email or call somebody if something looks amiss.
/background(fff)/960x743.jpeg?auto=webp)
Figure 2 – An executive summary welcomes the user
Individual product managers can dig deeper into Bookings, Attach Rate, or Margins. It is highly likely that the first task of a first-time visitor would be to filter the data down to their corresponding job responsibilities, so we made sure to make the filtering pane discoverable.
Recall that the original requirements from the client consisted of just snapshot comparisons of metrics, i.e. two pie charts. Simple, but based on user feedback, it just doesn’t quite satisfy the user’s needs. Through synthesis of user feedback, we added additional facets to the data, e.g. historical trend, customer breakdown, and tables.
The top-bottom display of graphs and tables may seem redundant, but based on the user feedback, this arrangement makes users the most comfortable. The graphs are attractive and is the better storyteller, but the tables help corroborate the stories.
/background(fff)/960x743.jpeg?auto=webp)
Figure 3 – Comparison of product bookings and service bookings, with options to see historical trend and customer breakdown.
/background(fff)/960x743.jpeg?auto=webp)
Figure 4 – Comparison of attach rates across products. The horizontal design is better for long product names and a large number of products, both of which were a reality of the client’s organization.
Since the application is new, users are likely to ask, “where are you getting these numbers?”. The source of the data is clearly displayed and explained. Furthermore, we offer the user an “out” – if they would rather go back to manual manipulation of the data, they can download all of the data like before.
Figure 5 – Animated sequence showing the informational pop-up that explains the source of the data, along with its assumptions and limitations.

Figure 6 – Animated sequence showing the Download feature. Should the user want to go back to the way things were, the Download feature is there to help them.
Process
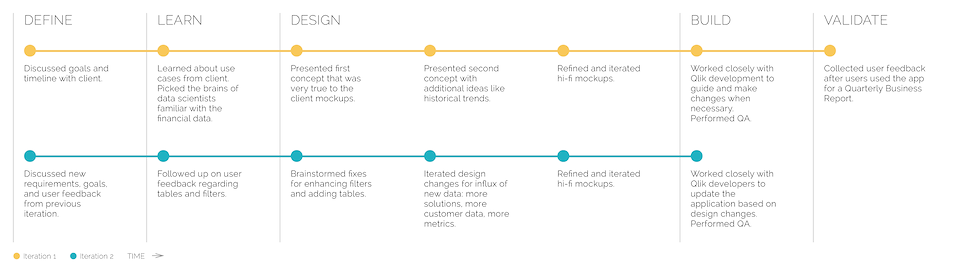
We performed two major iterations for this project. The following illustrates the process the design team went through:
Beyond this Project
After two iterations over a period of 18 months, we felt that the design was well matched for user needs. User feedback was generally very positive and the process is now less dependent on each user’s Excel skills. Some of the features we started to design but didn’t quite finish, like price modeling and instant update, required enhancements in the database backend first.